
South Wales and South England boundaries
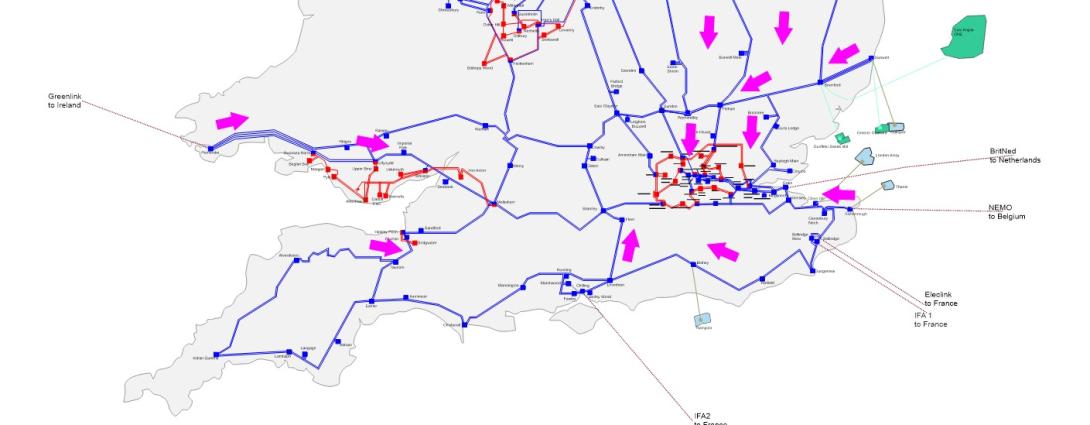
The region includes the high demand area of London, generation around the Thames estuary and the long set of circuits that run around the south coast and South Wales.
Interconnection to Central Europe is connected along the southeast coast and this interconnection has significant influence on power flows in the region by being able to both import and export power with Europe.
The South of England transmission region includes boundaries B13, B14, LE1, SC1, SC1.5, SC2, SC3 and SW1.
The map below shows the general pattern of power flow directions expected to occur most of the time in the years to come up to 2034. Power will generally flow from north to south. The arrows in the diagram illustrate power flow directions and are approximately scaled relative to the winter peak flows.
Regional drivers
The southern transmission network is densely meshed in and around the London (LE1) but becomes more radial and dispersed in the southwest. Most interconnectors are due to connect south of boundary SC1, the impact of these will be discussed later in the chapter in the south coast boundary sections.
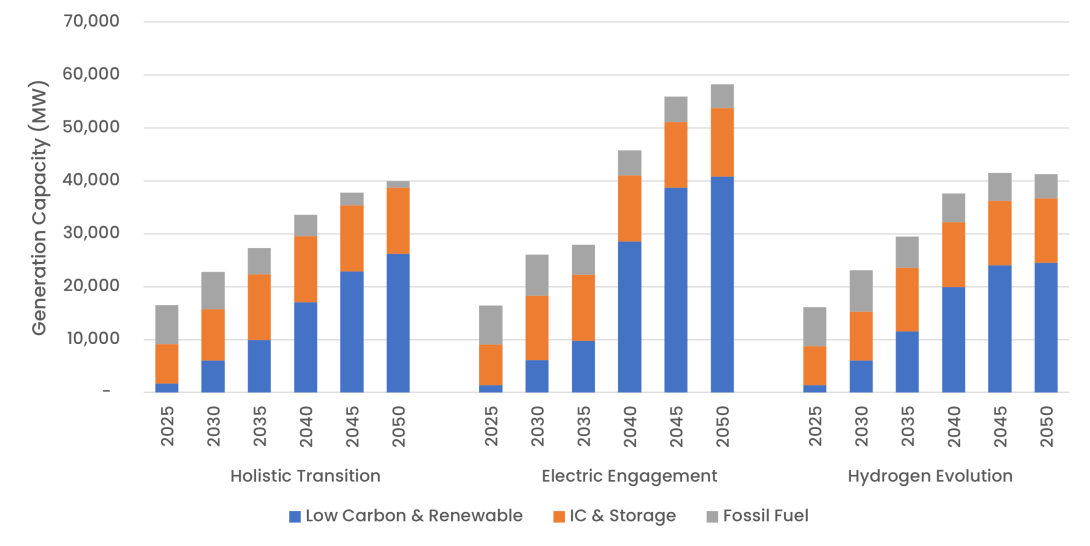
Interconnector and storage capacity is expected to reach 10–12 GW by 2030 (from 7.5 GW), operating bidirectionally and creating up to 12 GW of demand or power injection.
As new interconnectors come online, boundaries SC1, SC1.5, SC2, SC3, LE1 and B13 must accommodate large bidirectional flows. Limited local generation increases reliance on imports from outside the boundary, and without reinforcement, operating with all interconnectors importing or exporting heavily will be challenging.
High voltages in London arises from the high reactive power gain from the numerous cable circuits, particularly overnight when demand is low. Low-voltage issues are expected to become more prevalent around the south coast during high-flow periods, especially when the south-coast interconnectors are exporting power. The NESO’s Long Term 2029 Tender5 is seeking to procure services in this region to manage both high- and low-voltage issues in future.
Generation Capacity
Gross Demand
Boundary regions
Click on the regions below to expand the boundary and understand its capability and challenges.
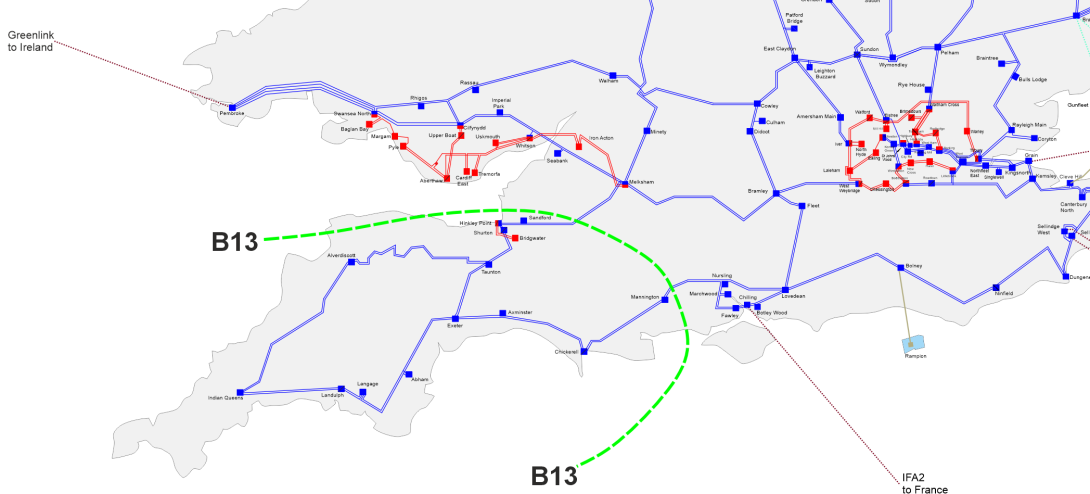
The southwest peninsula is a region with a high level of localised generation and demand. Until new generation or interconnectors connect there is very little variation in boundary requirements for B13, and the current importing boundary capability is sufficient to meet the short-term needs.
The volume of generation capacity expected to connect behind B13 mean the boundary is likely to trend more towards net exports. Further reinforcements may be required after 2030, following the connection of offshore wind projects in the South West. There is also an expected increase in embedded solar generation, with some nuclear and interconnector capacity coming in the early 2030s and continued battery growth.
Compared to ETYS 2024, ETYS 2025 shows a reduction in Required Transfer across all FES pathways. This reflects updated assumptions that increase the role of flexibility, storage, and demand-side response, improving local balancing and reducing extreme flows between regions.
Boundary flows and base capability
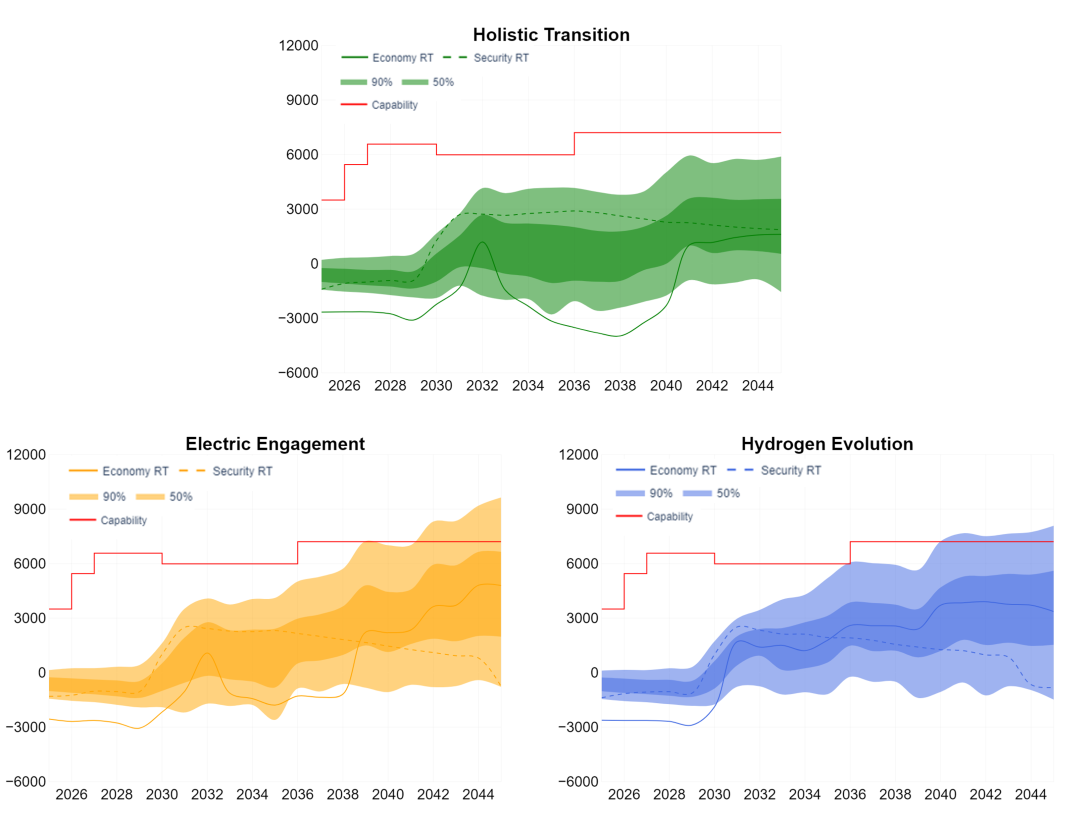
View an interactive version of the graph
The boundary capability is limited to 2.9 GW due to a voltage constraint for a fault on the Hinckley Point - Shurton 400kV double circuit.
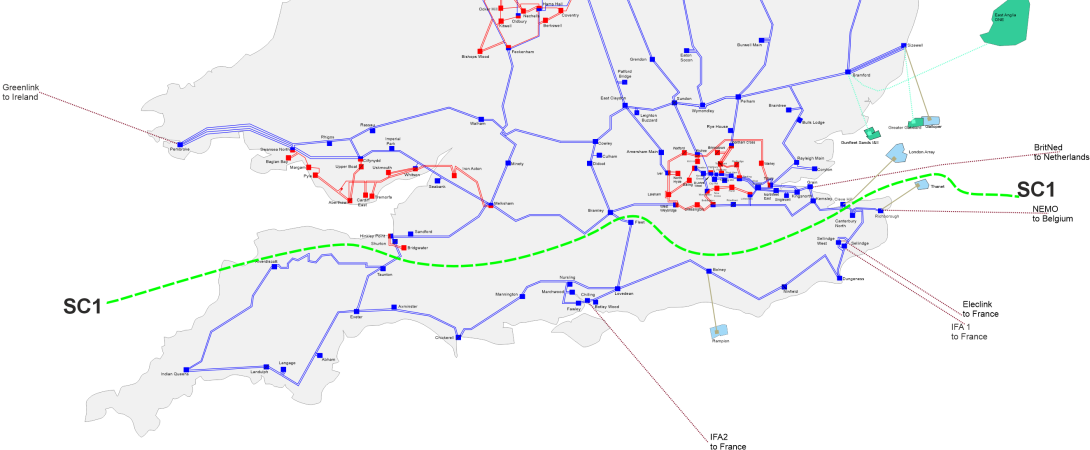
During winter peak demand, the power typically flows from north to south across the boundary due to the low volumes of local generation on the south coast.
Interconnector activity significantly influences this boundary power flow. There are currently four interconnectors to the continent landing along the south coast and the most significant driver for future requirements across SC1 will continue to be the connection of new continental interconnectors. These interconnectors can, at times, complicate the management of network flows and constraints in real-time. For instance, a 2GW interconnector like IFA can cause a 4GW difference on the boundary, switching from full export to full import mode or vice versa.
Across all FES pathways the expected flows move further into the importing region over future years. Capability is expected to be sufficient for both importing and exporting cases.
Boundary flows and base capability
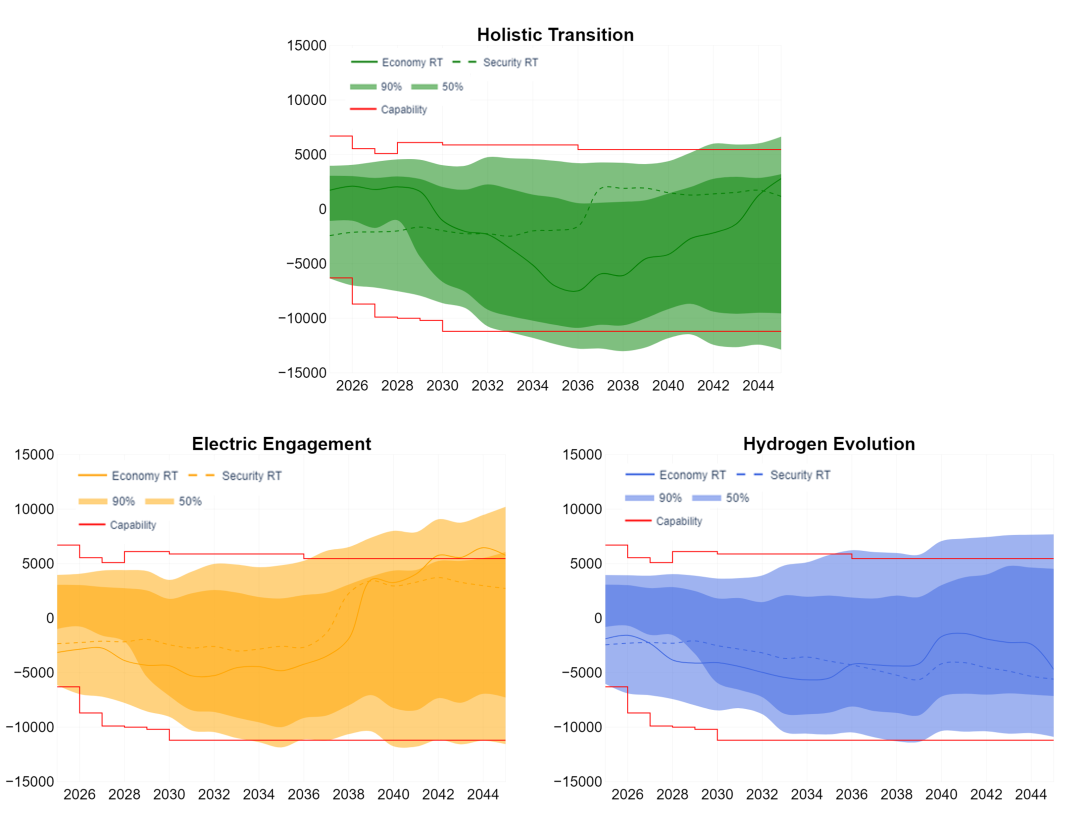
View an interactive version of the graph
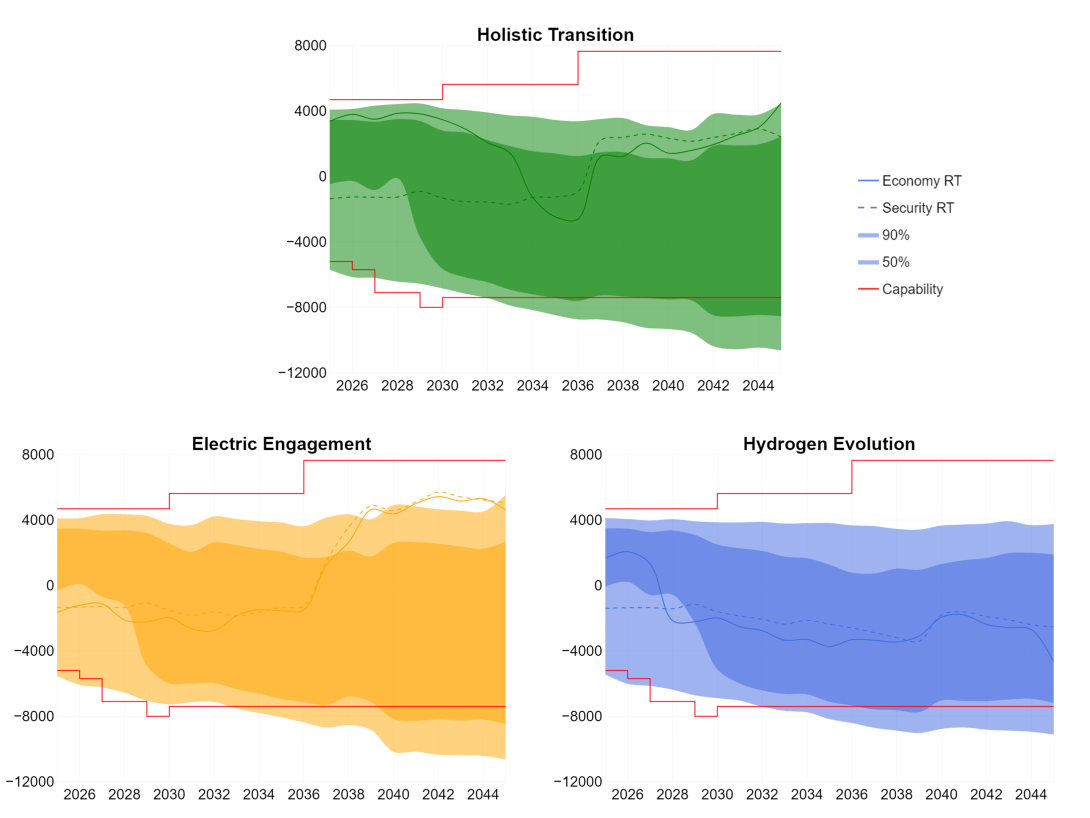
The boundary capability is limited to 6.4GW due to thermal constraints on the Bramley - Fleet 400kV single circuit 1.
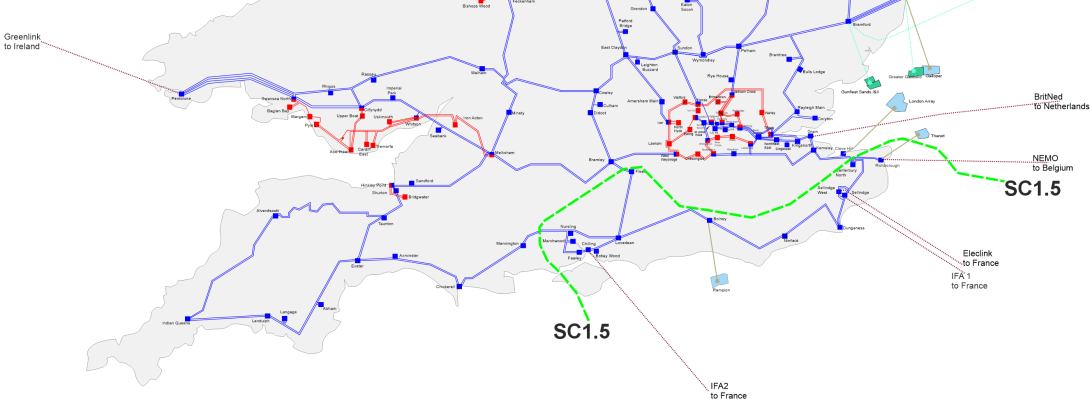
During peak winter demand in, power typically flows from north to south across the boundary due to the low volumes of local generation on the south coast.
The volatility of interconnector activity can be seen in the wide spread of expected boundary flows depicted by the shaded areas on the boundary charts.
Across all FES pathways the expected flows move slightly more toward importing on average, over future years. Capability is expected to be sufficient for both importing and exporting cases.
Boundary flows and base capability
View an interactive version of the graph
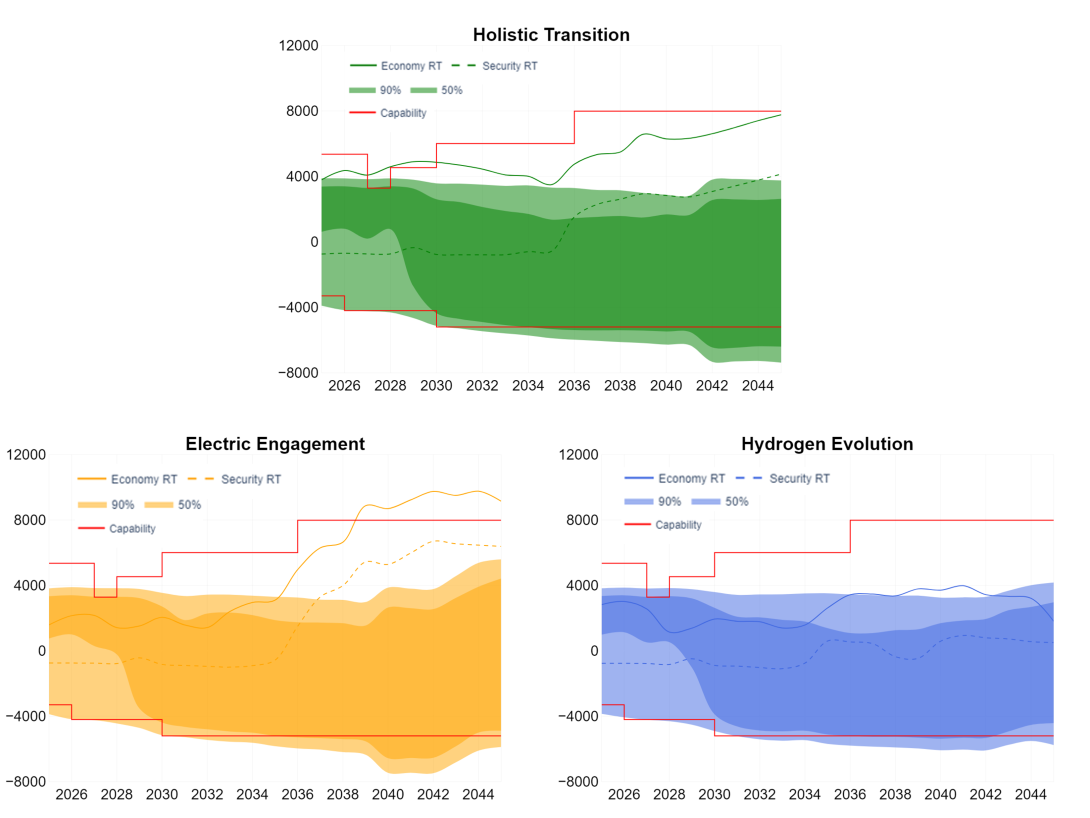
The boundary capability is limited to 5.3GW due to a thermal constraint on the Bramley - Fleet 400kV single circuit 1.
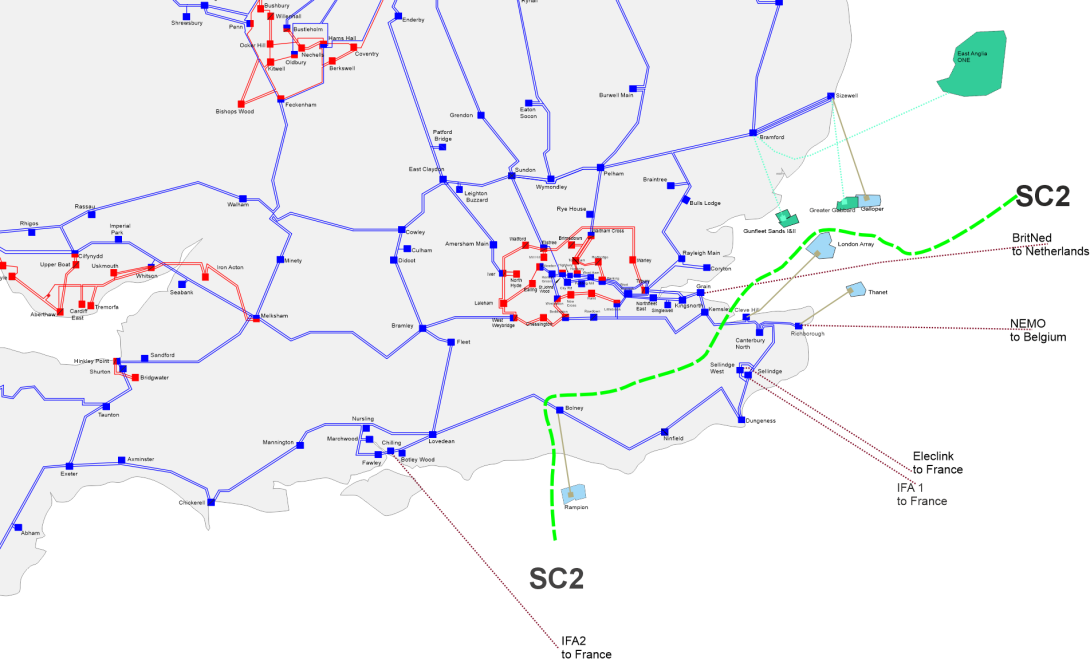
The 400kV route between Kemsley and Lovedean is relatively long and serves significant demand while connecting large generators and interconnections to Europe. A fault at either end can turn it into a long radial feeder, placing all the load on the remaining two circuits.
Additional generation and interconnectors contracted for connection below SC2 could lead to some constraints when windy periods occur in combination with outages around the southeast coast.
Across all FES pathways expected flows are projected to shift slightly more towards importing on average over the coming years. However, the capability is expected to be sufficient for both importing and exporting cases.
Boundary flows and base capability
View an interactive version of the graph
The boundary capability is limited to 3.3GW due to a thermal constraint on the Bramley - Fleet 400kV circuit 2.
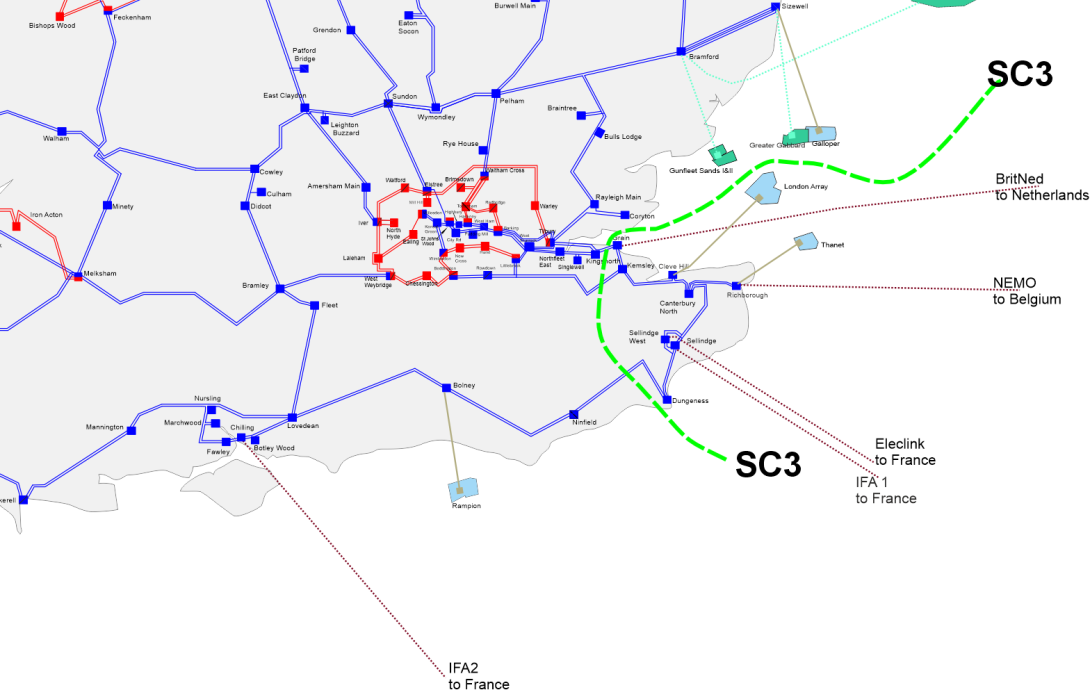
The current and future interconnectors to Europe have a significant impact on the power transfers across SC3. The current interconnectors to France, the Netherlands and Belgium connect at Sellindge, Grain and Richborough respectively.
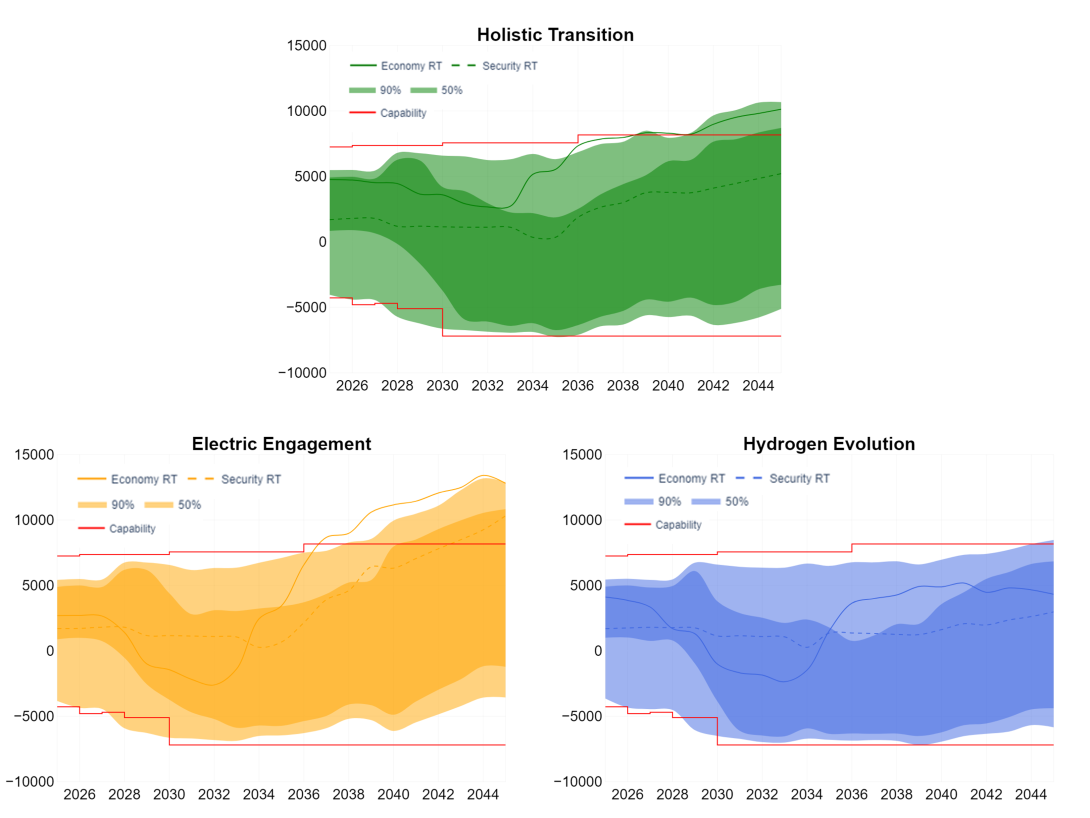
Across all FES pathways the expected flows move slightly more toward importing on average, whilst still expected to regularly export power for limited periods, in future years. Capability is expected to be sufficient for both importing and exporting cases.
Boundary flows and base capability
View an interactive version of the graph
The boundary capability is limited to 7 GW due to a thermal constraint on the Grain-Tilbury circuit.
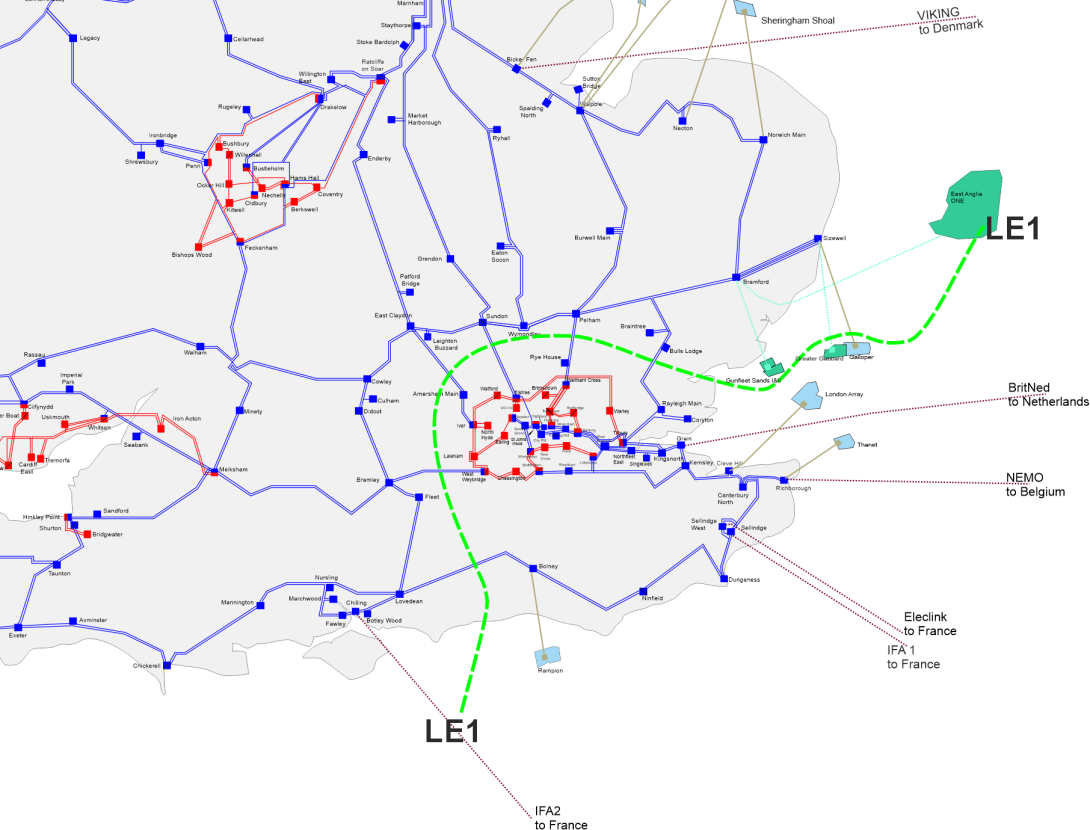
LE1 is characterised by two distinct areas. Within London, there is high local demand and little generation. The remainder of the area contains both high demand and high levels of generation.
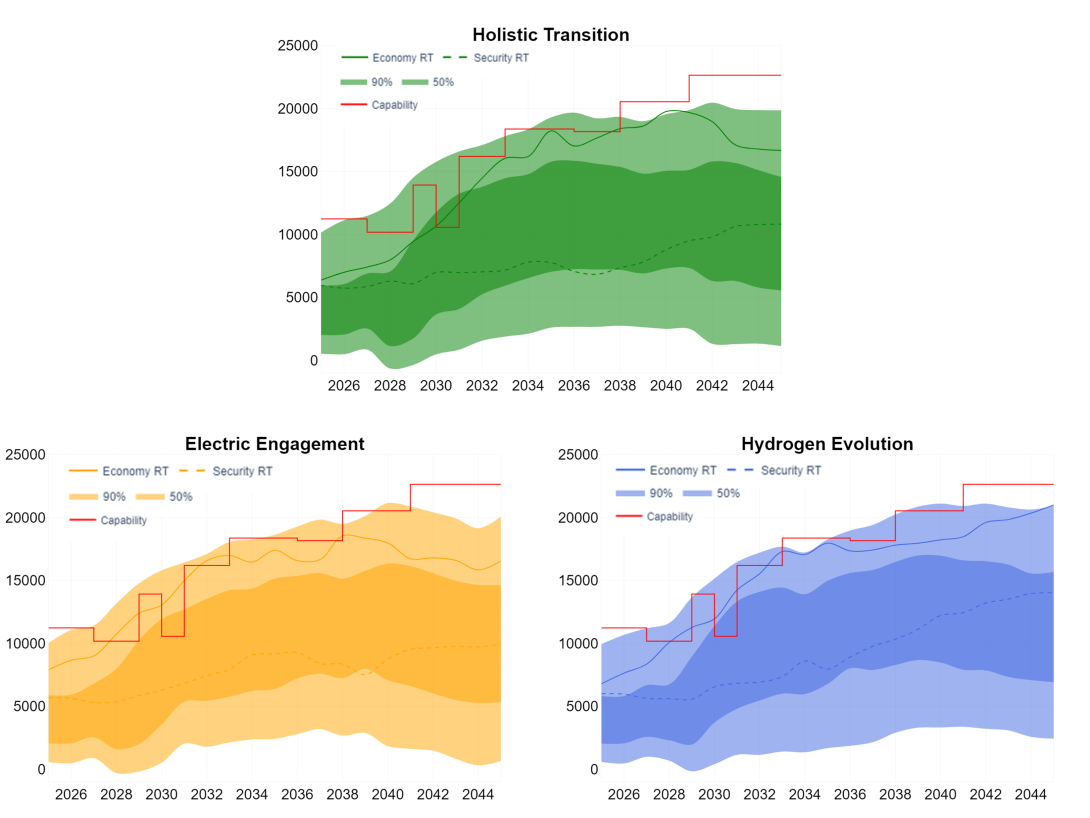
LE1 almost exclusively imports power from the north and west into the south-east, and the purpose of the boundary is to monitor flows in this direction. Due to this and for ease of reading, LE1 is defined in the reverse manner, positive flows on the boundary charts indicate power flowing into LE1 (importing).
Increasing interconnector exports to Europe drive an increase in power flows and a need for network reinforcements in the area over the coming years. Expected flows have increased compared to ETYS24.
Boundary flows and base capability
View an interactive version of the graph
The boundary capability is limited to 10 GW due to a voltage constraint for a fault on the Pelham-Bramford-Braintree 400kV circuits.
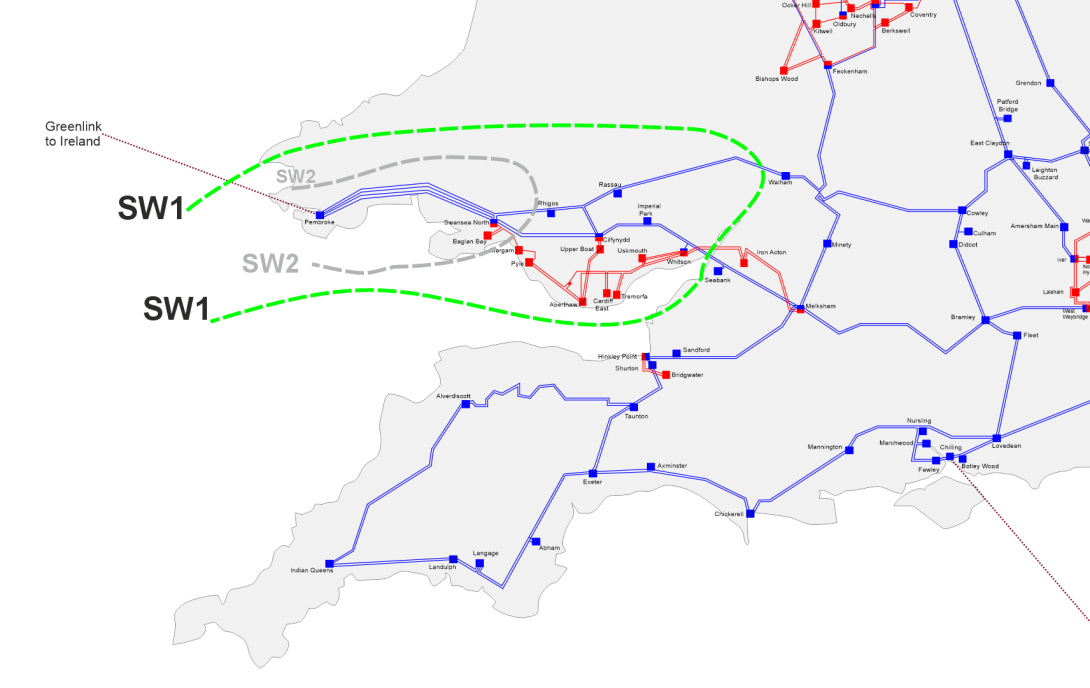
Contained within the boundary is a mixture of generation types including renewable generation and fossil fuel generation which are expected to close.
South Wales includes demand consumptions from the major cities, including Swansea and Cardiff, and the surrounding industry.
The boundary requirements are within the boundary’s present capability, and we expect this to remain the case for the foreseeable future, as seen in the boundary chart.
The NESO’s final recommended design for the Celtic Sea offshore sees up to 3GW of floating offshore wind connecting into South Wales, behind SW1, by 2035.
Boundary flows and base capability
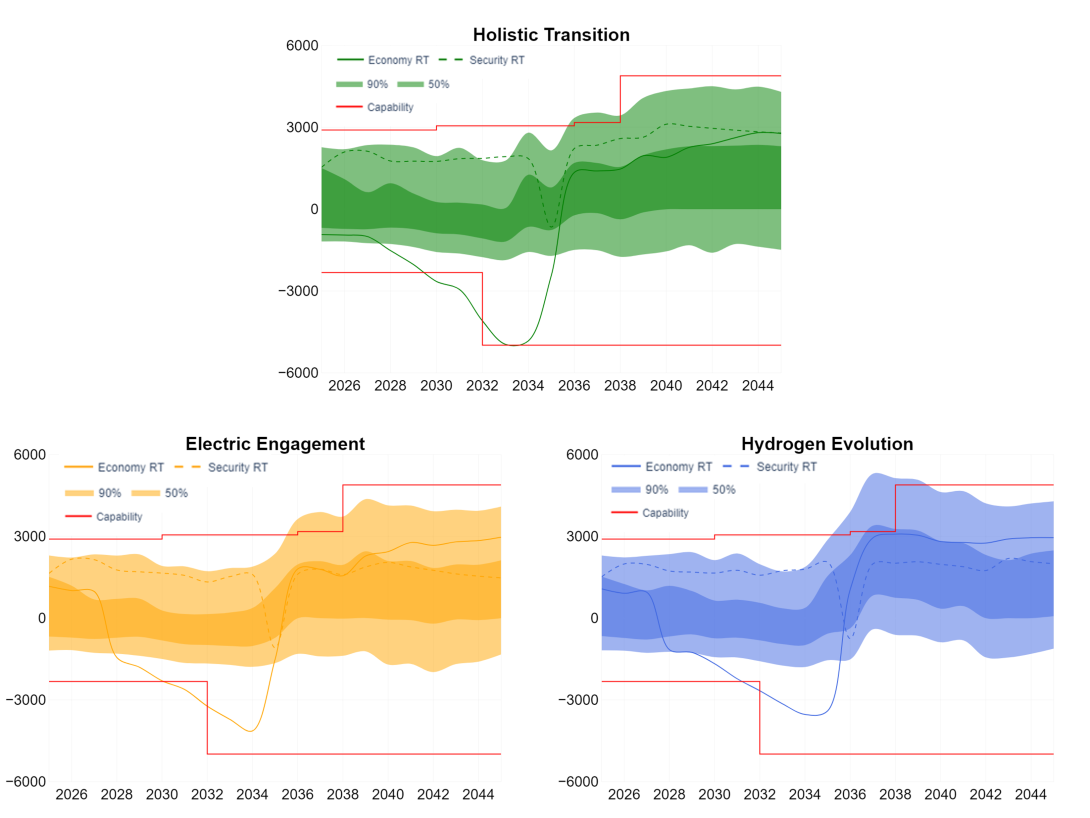
View an interactive version of the graph
The boundary capability is limited to 3.8 GW due to a thermal constraint on the Cowley-Walham 400 kV circuit.