
North Wales and the Midlands boundaries
The Western transmission region includes boundaries in the Midlands and the north of Wales.
This includes the lower midlands boundary B9 and the north Wales boundaries NW1, NW2, NW3 and NW4.
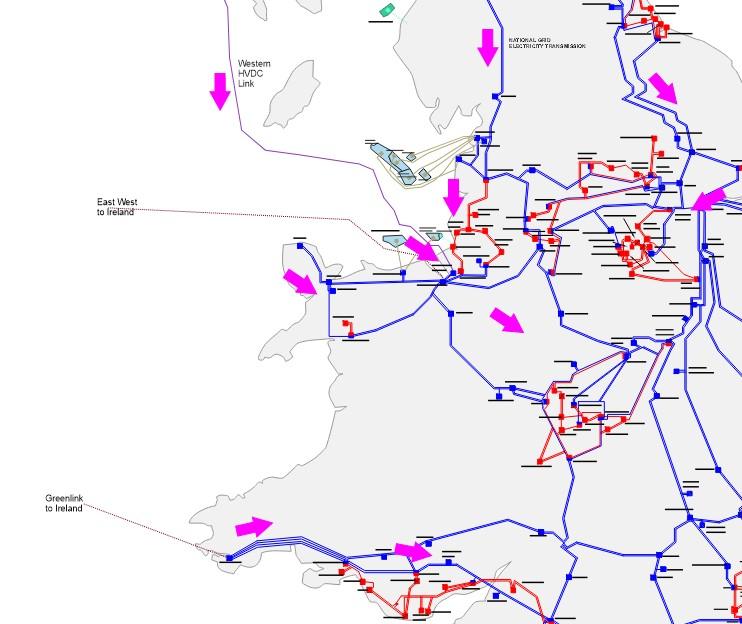
The map below shows the general pattern of power flow directions expected to occur most of the time in the years to come up to 2036, i.e. power will generally flow from north to south. The arrows in the diagram illustrate power flow directions and are approximately scaled relative to the winter peak flows.
Regional drivers
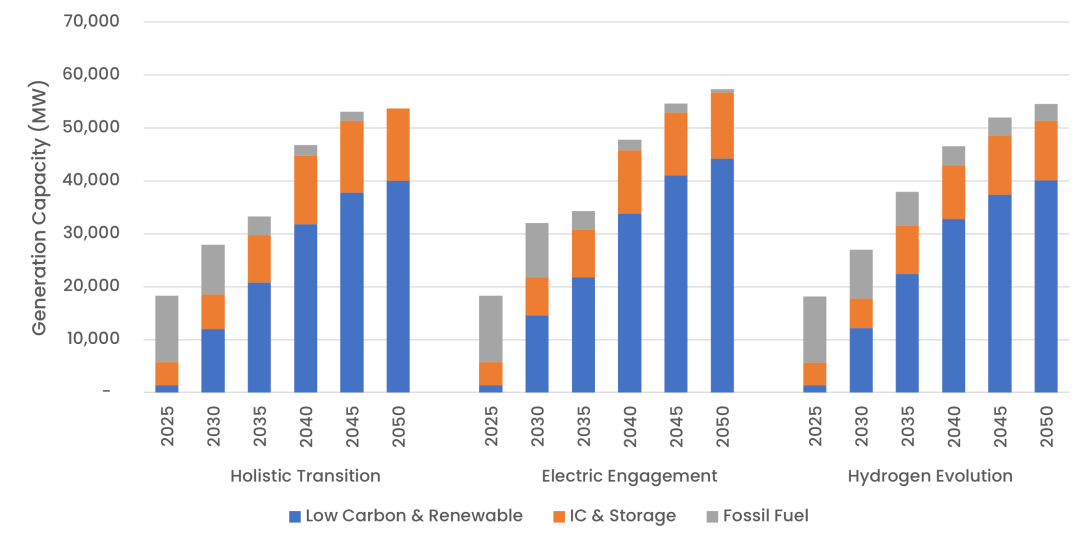
Today, this region has a high proportion of fossil fuel generation, which declines across all FES pathways by 2035 and is only fully phased out by 2050 under Holistic Transition. Generation and demand grow at broadly similar rates, with the region moving between net exports and imports under differing network conditions.
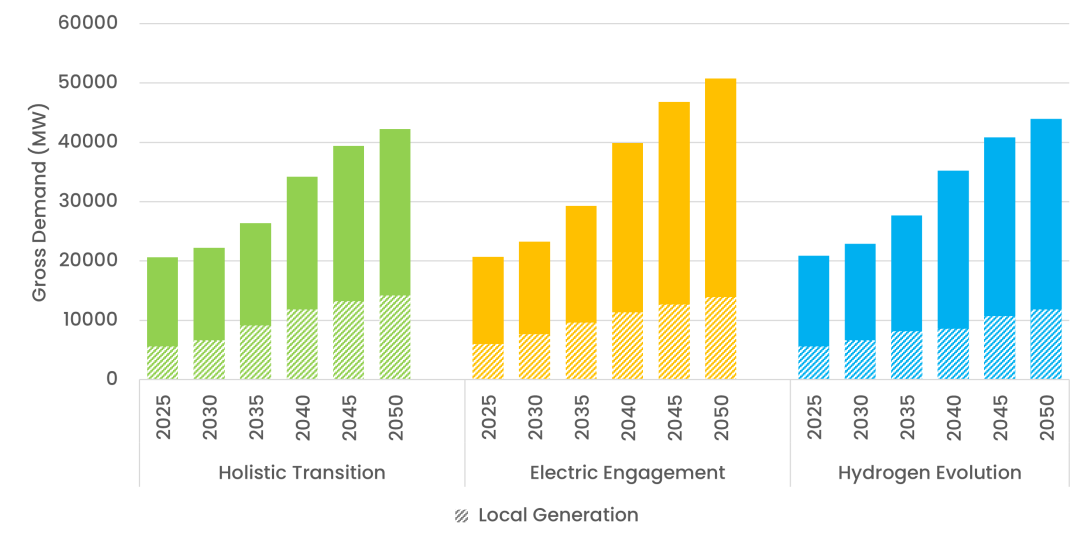
Transmission-connected capacity increases to 27-30 GW by 2030 (from 18 GW today), driven by growth in low carbon generation, alongside modest expansion of interconnectors and storage. Demand increases significantly across all scenarios after 2030, potentially reaching 50-60GW by 2050, and driven in large part by rising industrial and commercial demand.
Rising transfer volumes and reduced synchronous generation increase low-voltage risks, particularly across the B9 boundary, where additional local solutions may be required to manage low voltage issues during high-flow conditions
Generation Capacity
Gross Demand
Boundary regions
Click on the regions below to expand the boundary and understand its capability and challenges.
If you would like to learn how to interpret the graphs, click the button below.
=
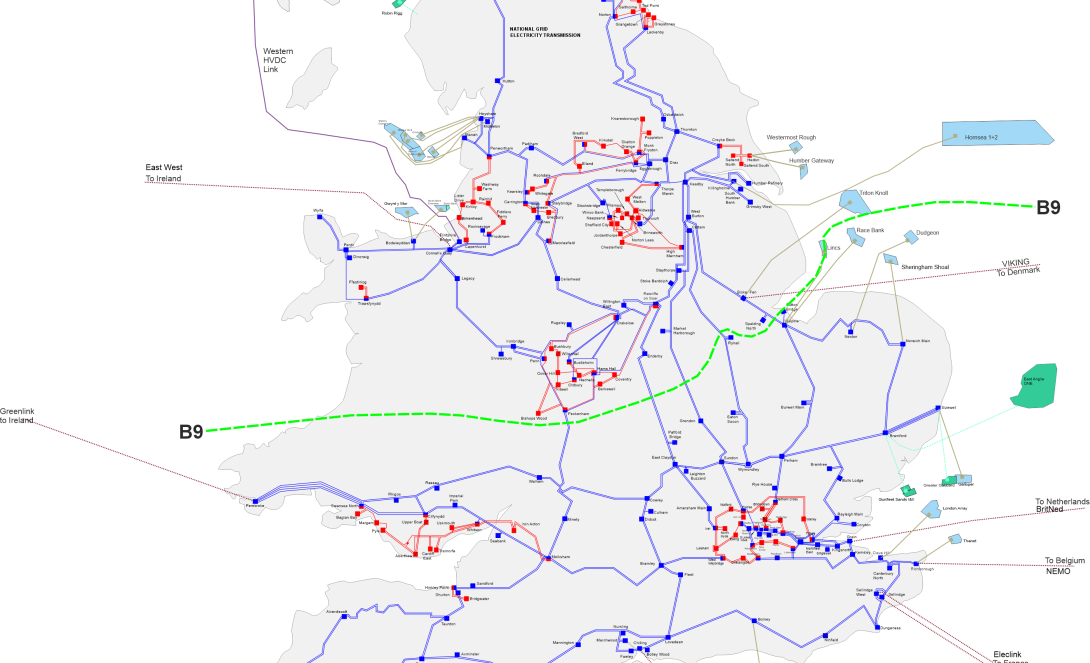
Developments in the east coast and the East Anglia regions, such as the locations of offshore wind generation connection and the network infrastructure requirements, will affect the transfer requirements and capability of boundary B9.
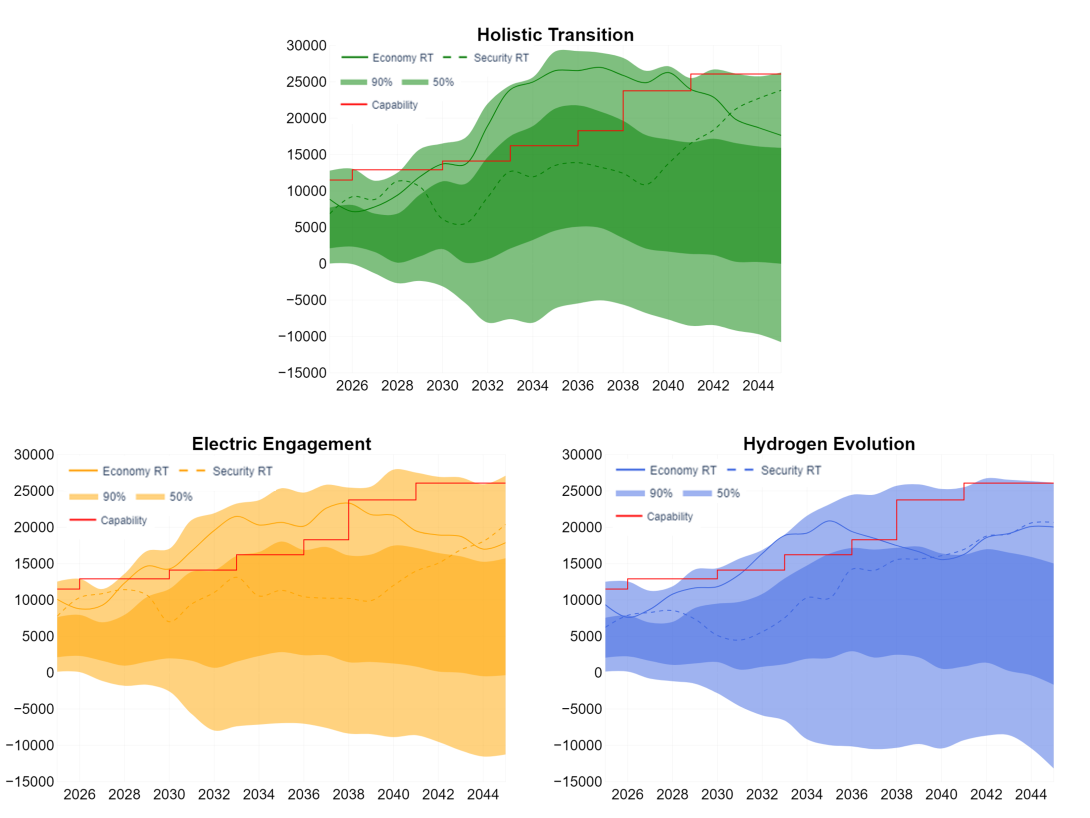
In all FES Pathways the expected flows increase to above the boundary capability for B9 after 2030. Expected flows have increased for Holistic Transmission and Electric Engagement scenarios but reduced slightly for HE compared to ETYS 24.
The FES show a lot of variable renewable generation in the north of boundary, meaning the spread of boundary power flows is very wide. During periods with low northern generation output it is credible to have power flowing from south to north feeding northern demand.
Boundary flows and base capability
View an interactive version of the graph
The boundary capability is limited to 11.5 GW due to a voltage constraint for a fault on the Spalding North – Walpole – Bicker Fen 400kV circuits.
North Wales
Boundary regions
Click on the regions below to expand the boundary and understand its capability and challenges.
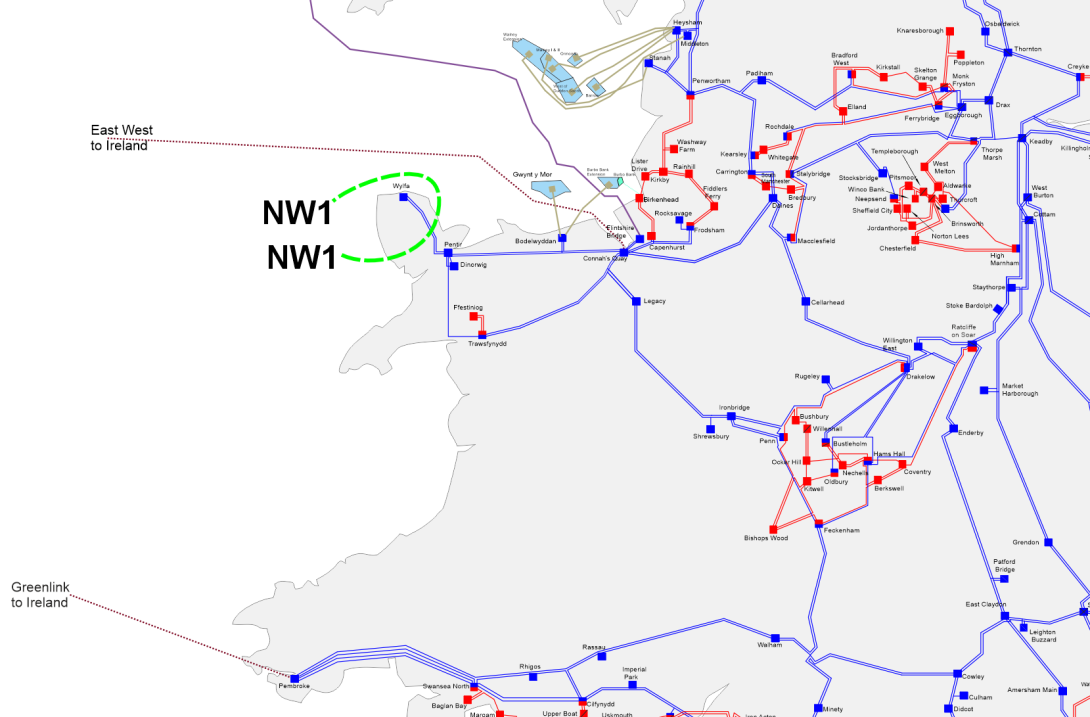
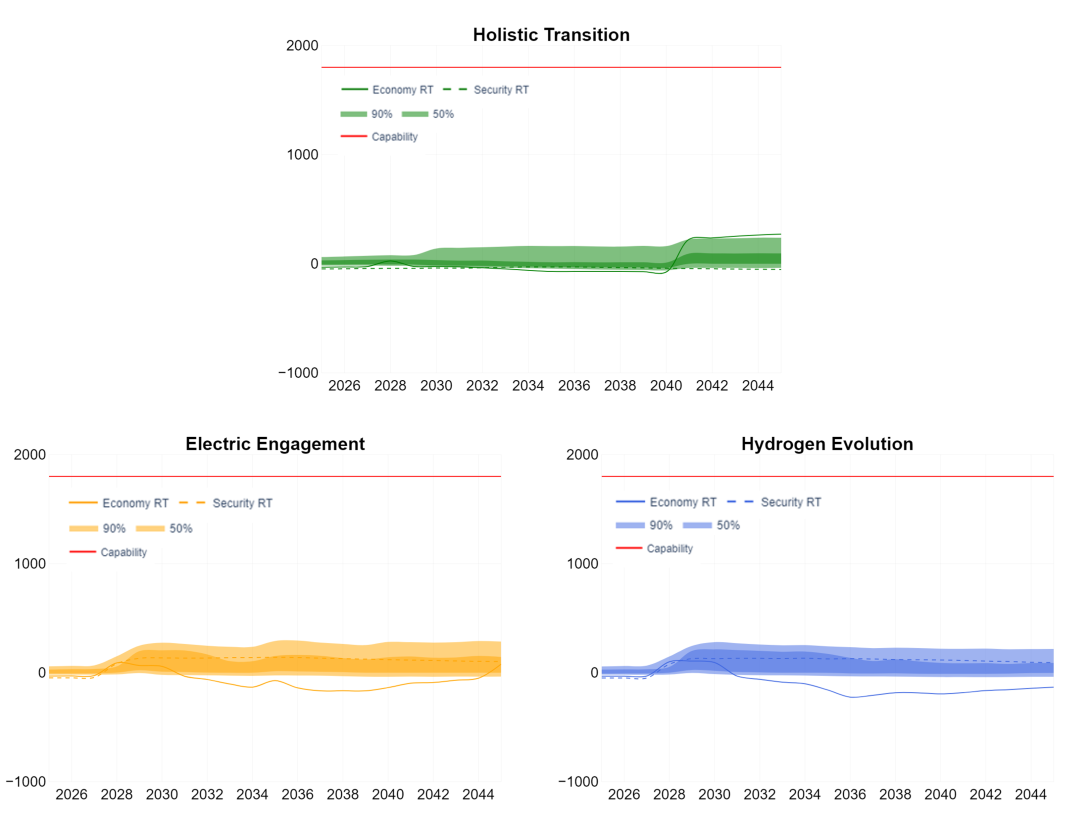
There is currently very low amounts of transmission-connected generation behind NW1 following the closure of Wylfa power station in 2015. However, there is some renewable and storage plant. Due to this low generation behind the boundary - it is expected within the later years for NW1 to become predominantly importing.
Boundary flows and base capability
View an interactive version of the graph
The boundary capability is limited by the infrequent infeed loss risk criterion set in the SQSS, currently 1.8GW.
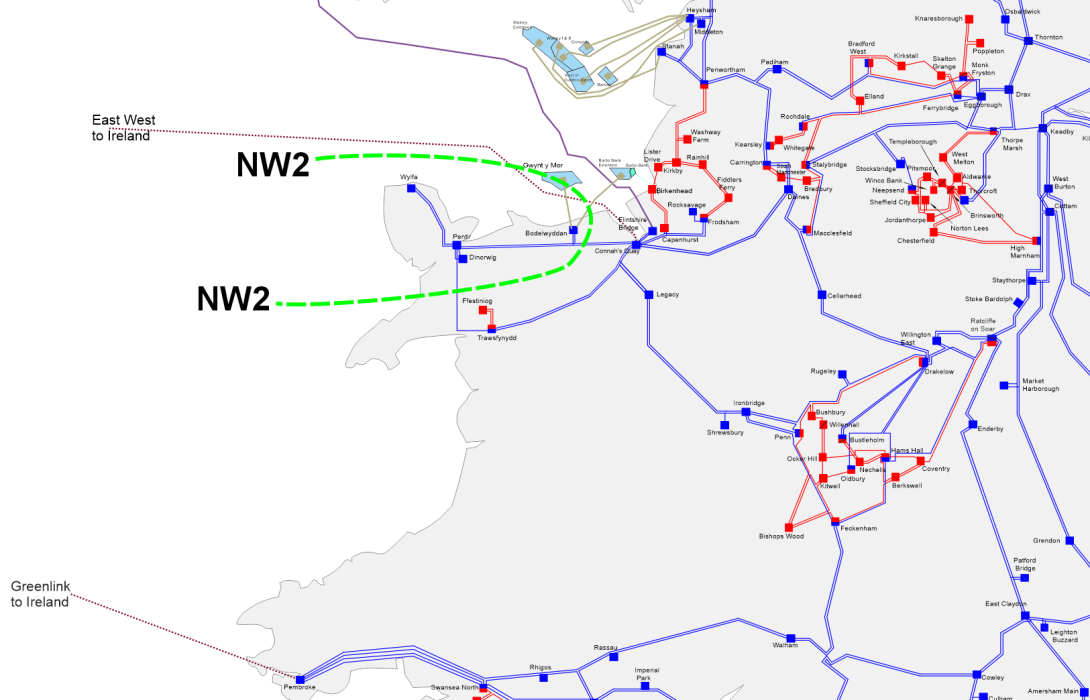
Currently, there is not a significant amount of generation behind NW2, mainly pumped storage and offshore wind projects.
Expected transfers across NW2 after 2028 will rise due to the additional offshore wind generation projects landing within the boundary, planned reinforcements in the area will facilitate this new generation capacity.
Boundary flows and base capability
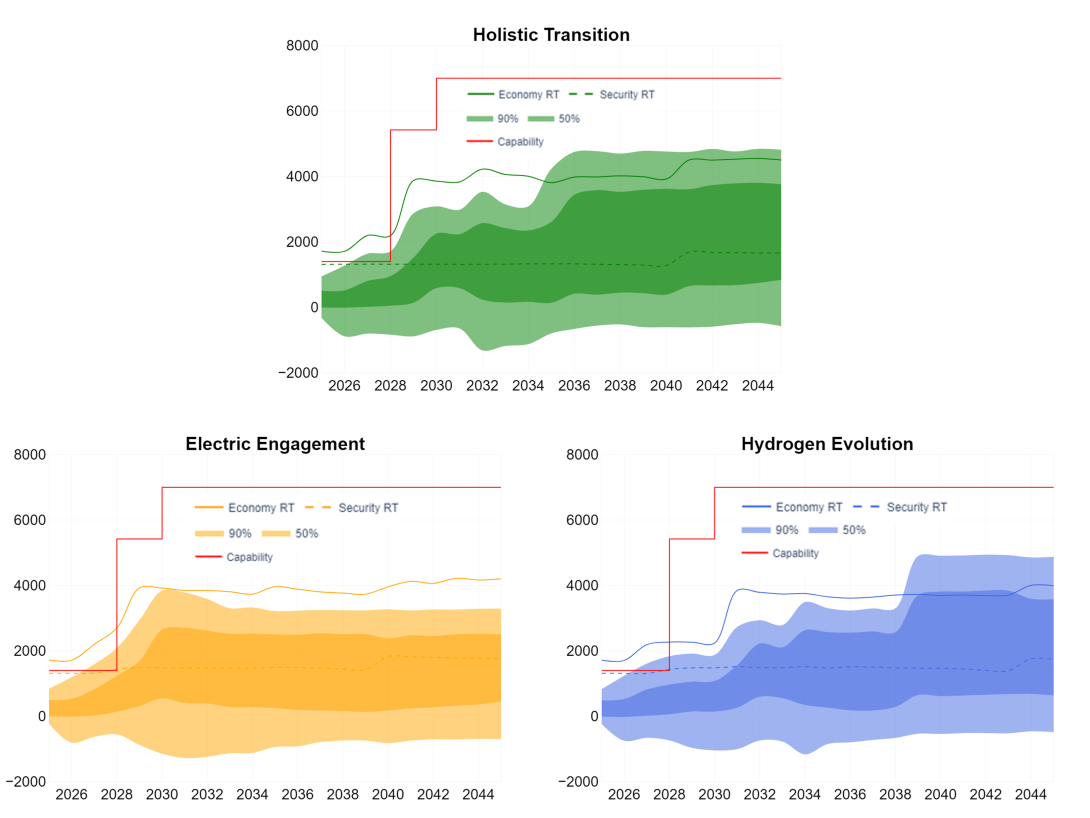
View an interactive version of the graph
The boundary capability is limited to 2.0GW due to a thermal constraint on the Pentir - Trawsfynydd 400kV circuit.
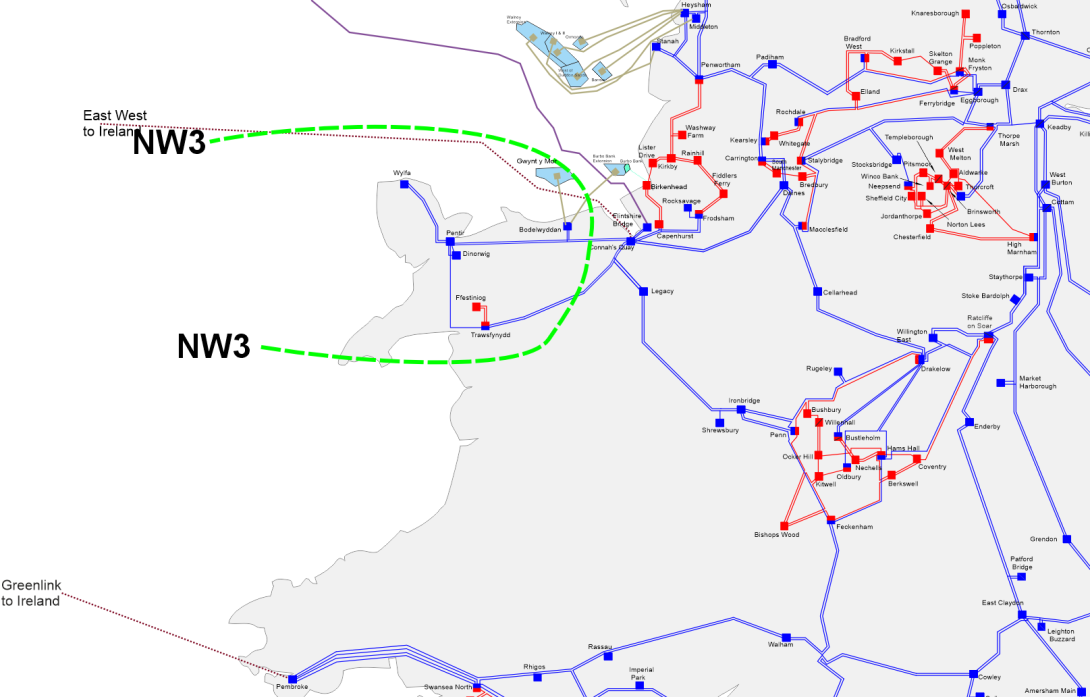
The profile of NW3 is largely similar to that of NW2.
Expected transfers across NW3 after 2028 will rise due to the additional offshore wind generation projects landing within the boundary, planned reinforcements in the area will facilitate this new generation capacity.
Boundary flows and base capability
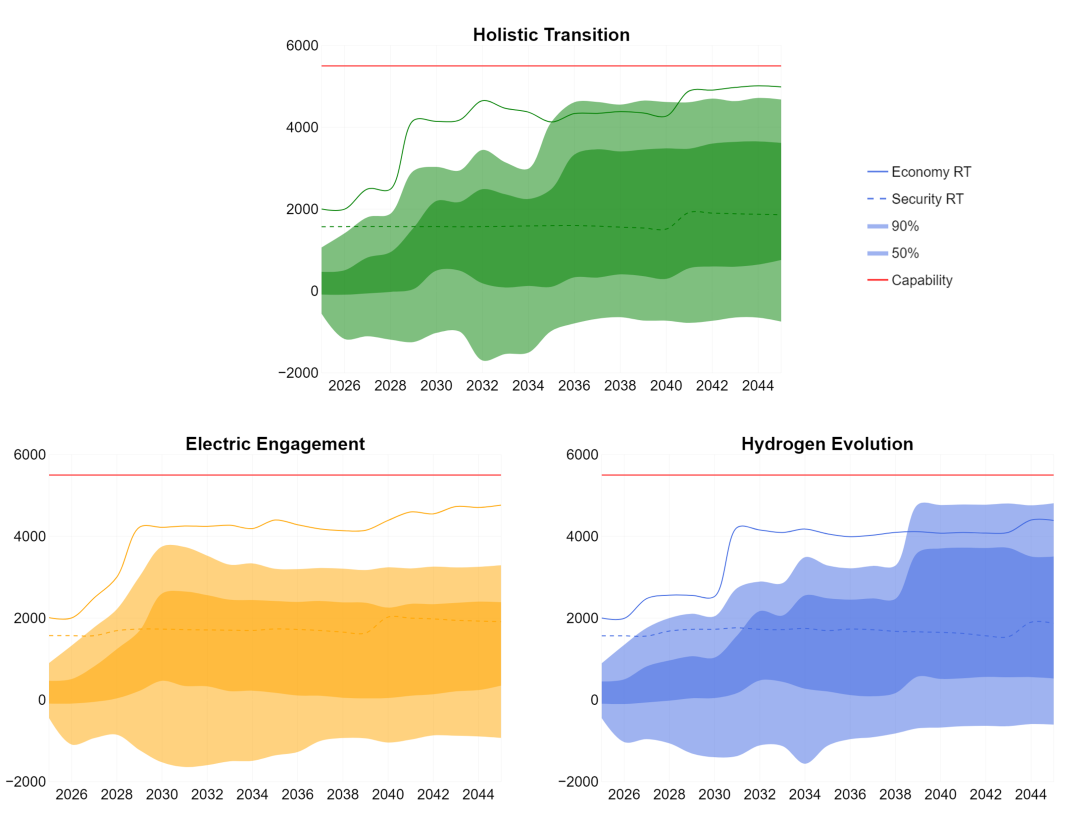
View an interactive version of the graph
The boundary capability is limited to 4.5 GW due to a thermal constraint for on the Legacy - Shrewsbury 400kV circuit .
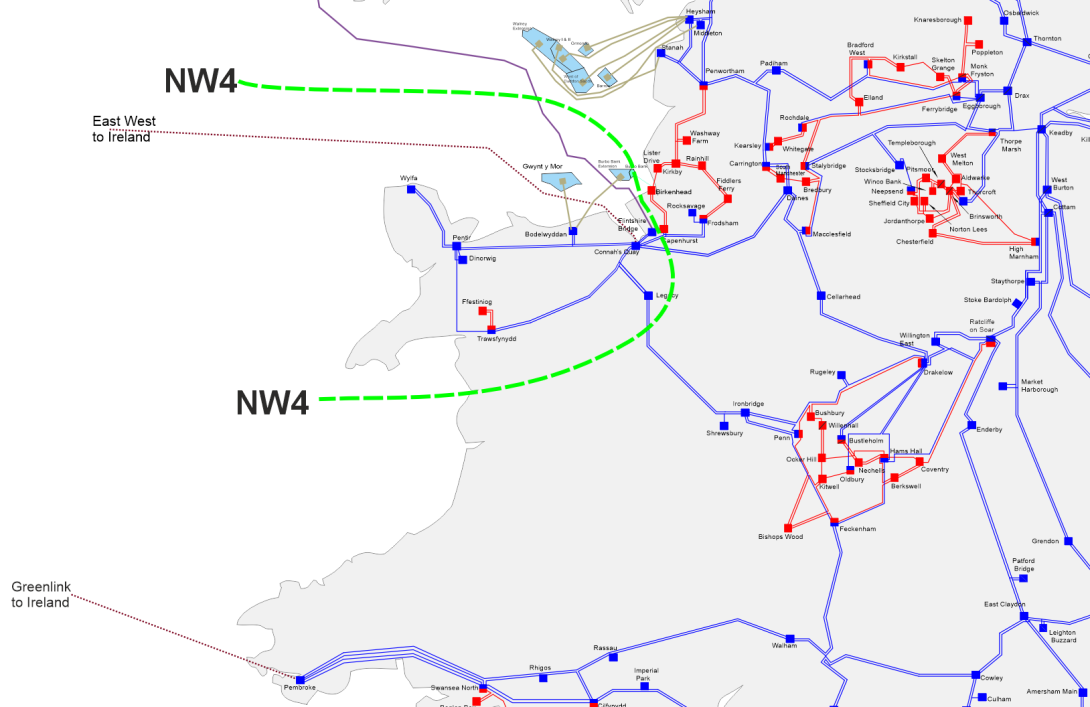
The profile of NW4 is largely similar to that of NW3.
Expected transfers across NW4 post-2028 will rise due to the additional offshore wind generation projects landing within the boundary, planned reinforcements in the area will facilitate this new generation capacity.
Boundary flows and base capability
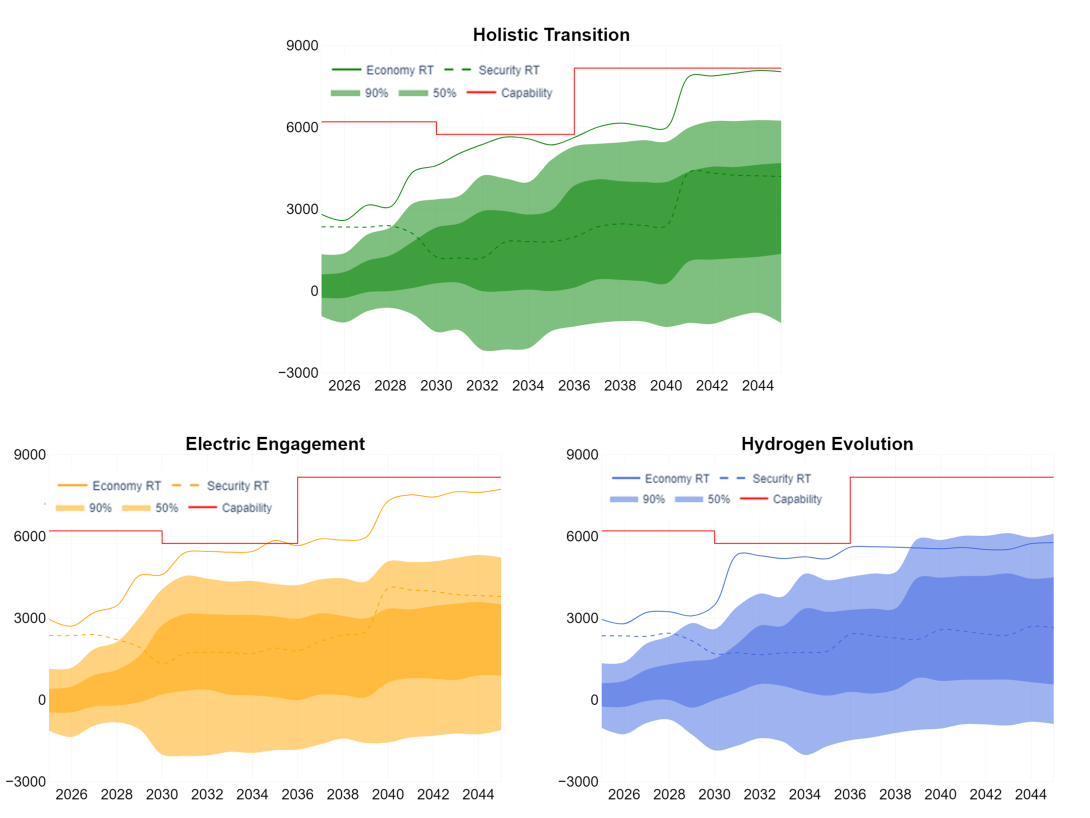
View an interactive version of the graph
The boundary capability is limited to 6.2GW due to a voltage constraint for fault on the Connah’s Quay - Daines 400kV circuits.