
Great Britain’s Monthly Energy Stats
Great Britain’s energy explained: November
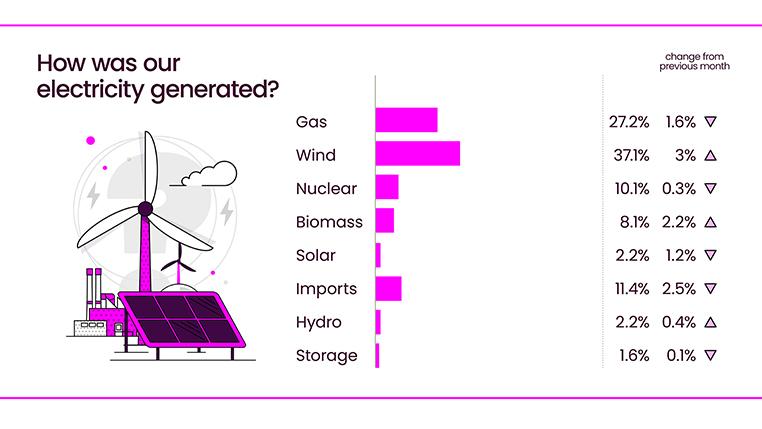
In November, wind was the primary source of electricity generation for the fourth consecutive month, providing 37.1% of Great Britain’s total supply, while gas came second at 27.2%.
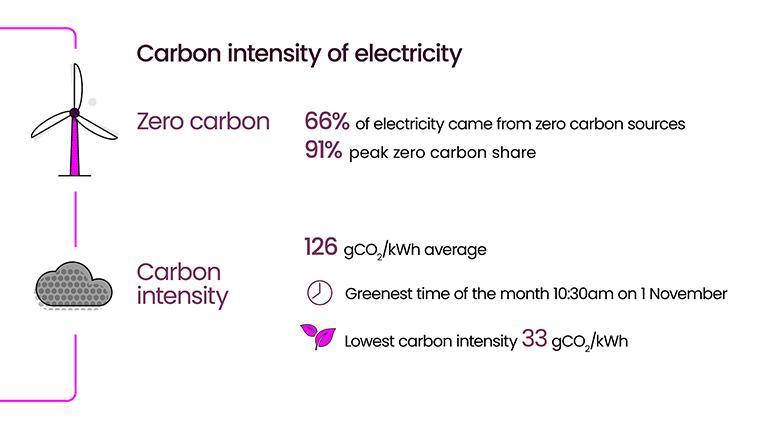
Zero-carbon sources made up 66% of our electricity, reaching a peak of 91% on 30 November at 5am.
The highest electricity demand was recorded at 43,666 MW on 20 November at 4:30pm.
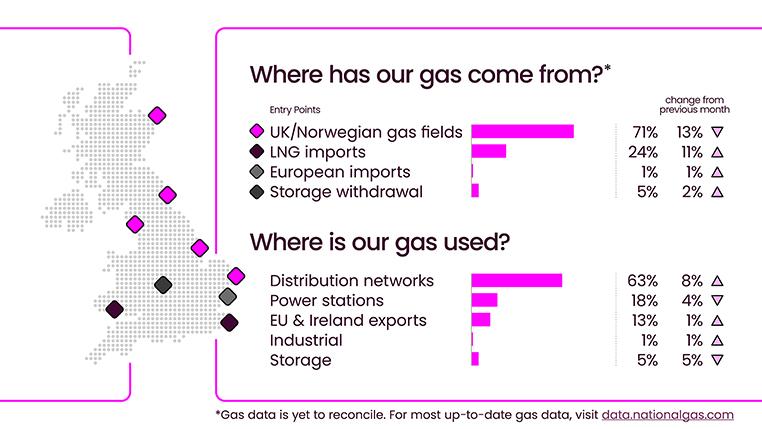
Most of our gas supply, 71%, came from UK and Norwegian gas fields, with Liquefied Natural Gas imports providing 24% and storage withdrawal 5% and imports the remaining 1%.
Distribution networks transported 63% of our gas to homes and businesses and 18% was used to generate electricity.
If you have any questions about these figures, contact us here.
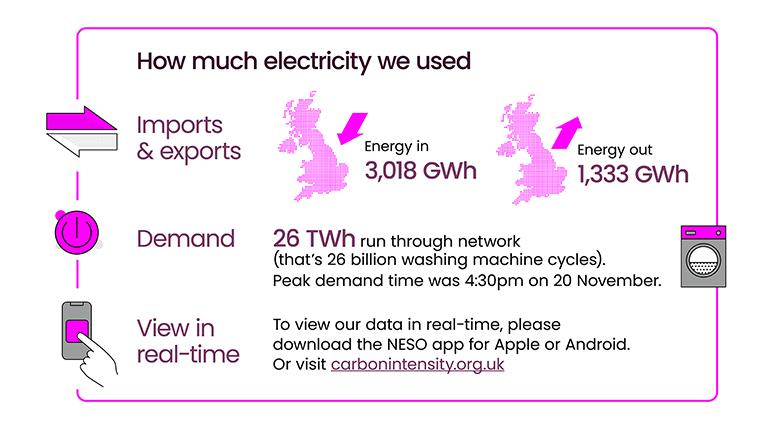
Our control room experts continue to balance electricity supply and demand second by second – and you can follow the electricity mix live in our carbon intensity app - available on Google Play Store and The App Store.
Need more reports?
All of our monthly electricity reports are available to download and share.
| Name | Published Sort ascending |
|---|---|
| November 2025 Energy Report | 4 Dec 2025 |
| October 2025 Energy Report | 6 Nov 2025 |
| September 2025 Energy Report | 3 Oct 2025 |
| August 2025 Energy Report | 3 Sep 2025 |
| July 2025 Energy Report | 6 Aug 2025 |
| June 2025 Energy Report | 3 Jul 2025 |
| May 2025 Energy Report | 6 Jun 2025 |
| April 2025 Energy Report | 8 May 2025 |
| March 2025 Energy Report | 8 Apr 2025 |
| February 2025 Energy Report | 5 Mar 2025 |
