Balancing services
The Balancing Act Part 2: Outturn
9 Nov 2026 - 4 minute read
Continuing our short series on balancing costs, this blog looks at the 2025/26 outturns. Costs were…


This is the third and final blog in our mini-series on balancing costs, looking at our latest projections for thermal constraint costs.
Costs are expected to remain high and rise towards 2030, before falling as major new network capacity comes online. That’s a similar story to our previous analyses. But there is considerable uncertainty around both the level and the timing. That’s why we’ve deliberately published a range of projections rather than a single number.
Crucially, there are things that can be done to limit the increase, in both the short-run and the long-run.
As a reminder, thermal constraints occur when the electricity grid can’t safely carry all the available power because the transmission lines are full. These costs make up around two-thirds of total balancing costs and have been growing (see blog 1). In 2025/26 thermal constraints were £2.0bn, though they’d have been higher without actions by NESO and our partners to contain them (see blog 2).
If you follow NESO’s regular data updates, you’ll know that balancing costs so far in 2026 are up on 2025. That partly reflects a higher volume of constraints, and particularly in recent months, higher gas prices making the replacement energy needed to manage them more expensive.
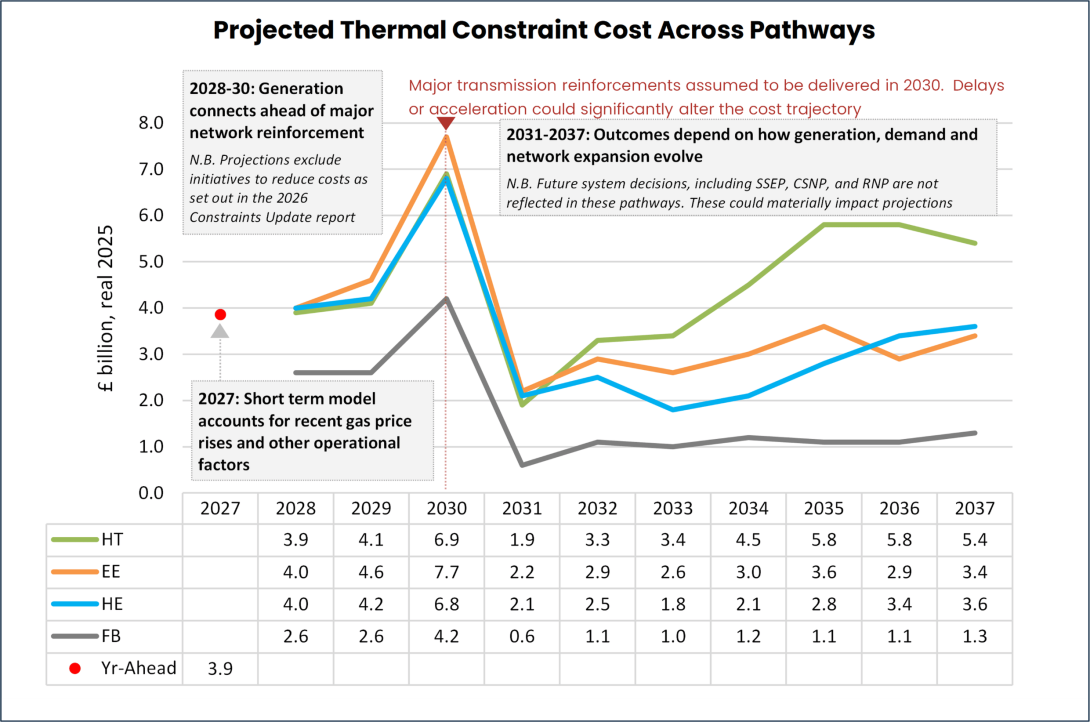
Our short-term forecast is for thermal constraint costs of £3.9bn in 2027, reflecting an expectation of continued high gas prices alongside significant network constraints. Network outages also continue to play an important role – these are needed to reinforce the network but we estimate 2027 thermal constraint costs would be 16% lower without them. That illustrates a tension in the transition: work to reduce constraints tomorrow can temporarily increase them today.
Further out uncertainty increases, so we consider a range based on our Future Energy Scenarios 2025. Importantly, these are scenarios, not predictions.
Across all the pathways, constraint costs fall sharply in the early 2030s as significant new network capacity is delivered. If network capacity could be delivered earlier, this could reduce 2030 costs, as we highlighted in our Clean Power 2030 advice
In later years, costs could remain relatively flat or begin rising again. That depends on whether further changes in generation and demand are matched by sufficient network capacity, and on location as much as quantity.
Accelerating network delivery remains the single biggest structural lever for reducing future thermal constraint costs. But it isn’t the only lever.
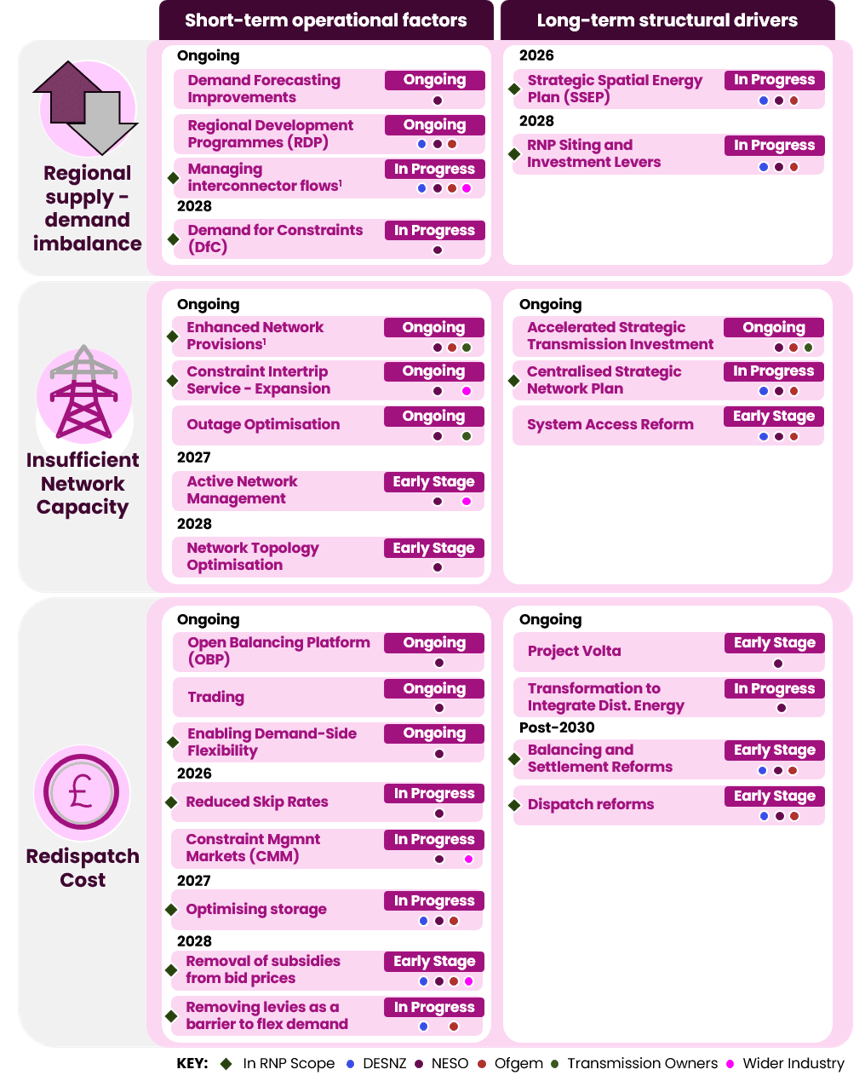
Our new report identifies 26 initiatives across strategic planning, markets, network utilisation and system operation. These are being developed by NESO, Govt and industry partners, including:
Across all these actions, the target isn’t constraint costs alone. Our decisions aim to minimise overall system costs and, ultimately, energy bills for consumers.