
Balancing services
The balancing act
3 Nov 2026 - 3 minute read
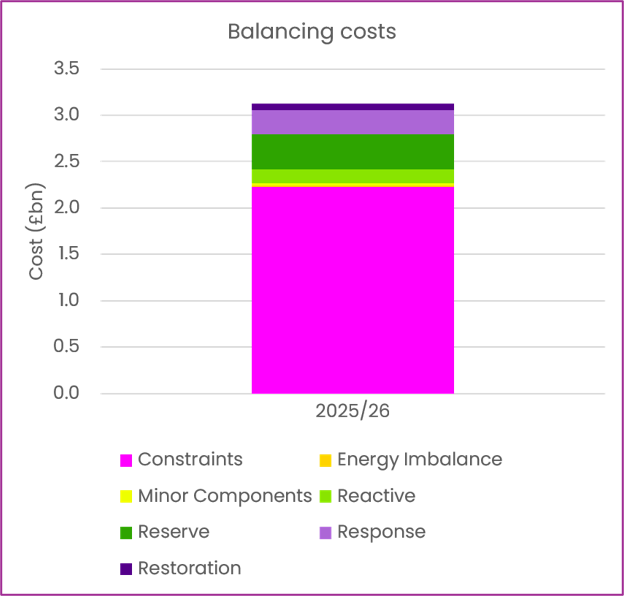
Let’s talk balancing costs. They’ve grown recently, to £3.1 billion in 2025/26, worth 4.3% on a…


Continuing our short series on balancing costs, this blog looks at the 2025/26 outturns. Costs were up 16% on the previous year. Let’s unpack why and what NESO is doing with the levers in its control, with actions delivering a quantified saving of £0.9 billion in 2025/26. Read more in our reports (2025/26 edition out soon).
Balancing costs increased 16% in 2025/26 to £3.1 bn. A little under £0.5 bn of that was paid to wind farms to turn down. Thermal constraints, those bottlenecks where power lines can’t safely transport any more power, remain the largest component. The costs of keeping voltage steady and responding quickly to changes in supply and demand also rose, as the needs of the electricity system continued to change.
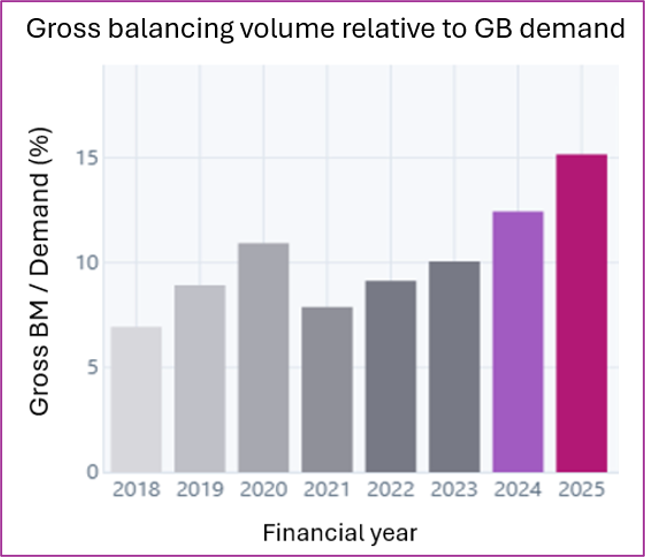
NESO is taking more balancing actions to manage a more complex electricity system. For every unit of electricity the country uses, we’re now doing more than twice as much balancing as in 2018. That reflects how much more complex the system has become to operate. It was this increase in volume that drove higher costs in 2025/26.
My clever colleagues at NESO and the Transmission Owners do a host of things that stopped costs being higher than they need to be, delivering £891m of quantified savings in 2025/26:
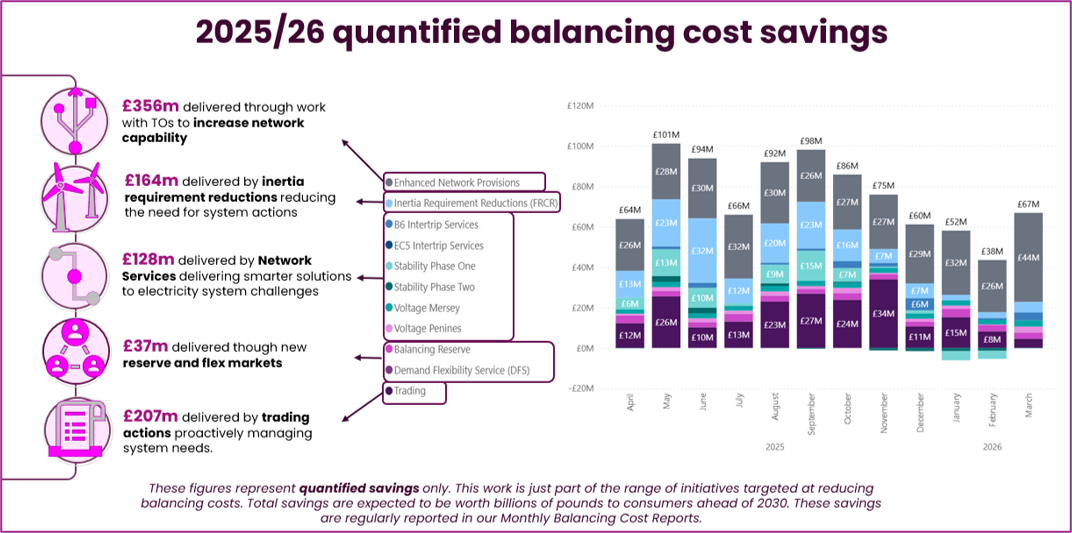
Outturn reporting helps us focus our efforts to reduce costs. It guides where network capacity needs to increase, when to plan outages, changing system needs, and where competition, better forecasting, trading and operational tools can help.
October and December 2025 give a neat example of the importance of the network. Despite similar wind conditions and prices, October had 34% higher balancing costs, reflecting more outages:
It’s natural to ask who to blame: Is it the wind (we didn’t have this problem before)? The network (that’s where the actual constraints are)? Or the gas (where most of the cost gets spent)?
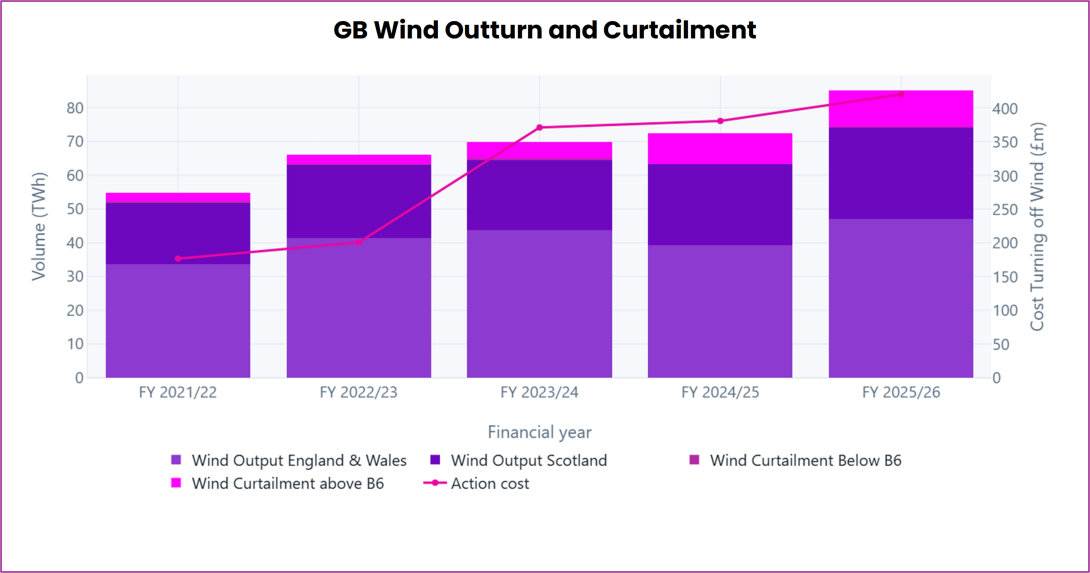
Bonus points on wind:
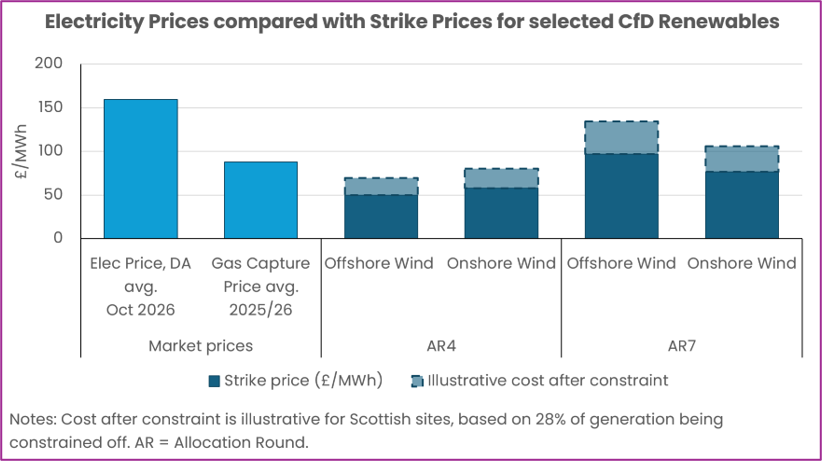
Really, it’s the combination that results in high constraint costs. Lots of wind, not enough electricity network, and high gas prices are a tricky mix. Longer term we need a stronger network – it’s the single biggest lever to lowering costs. And we need better coordination across demand, network, and generation – that’s the goal for NESO’s strategic planning, and for the market reforms Government are developing.
Meanwhile, NESO and our partners are finding ways to get more from the grid we already have and keep costs down where possible.