
Balancing services
Pembroke project marks latest milestone in clean grid…
7 Aug 2026 - 3 minute read
A new clean grid technology project at Pembroke is now helping keep Britain’s electricity system…


Let’s talk balancing costs. They’ve grown recently, to £3.1 billion in 2025/26, worth 4.3% on a typical household electricity bill. They’re projected to rise further to 2030, then fall as new electricity network, built by Transmission Owners, comes online. This is the first of a short blog series looking at the evidence.
Balancing covers the costs associated with operating the system in real time, and making sure demand and supply always balance, including managing voltage and frequency. NESO publishes lots of data through the year and we will soon release our annual report covering how these costs looked over 2025/26.
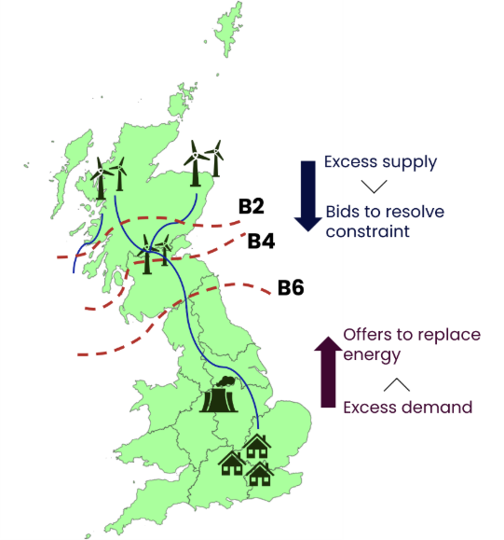
The biggest and growing share, around two-thirds, comes from limits on how much electricity the grid can safely and reliably carry. When cheaper power (e.g. wind) can’t reach where it’s needed within those limits, we have to pay for more expensive power (often gas) closer by instead. These are known as ‘thermal constraint costs’.
Typically in GB today, constraints affect the flow of power from north to south, especially over the transmission boundary between (high-wind) Scotland and (high-demand) England (known as ‘B6’ – see map). In future, other boundaries will matter too, such as from the east coast (and its offshore wind).
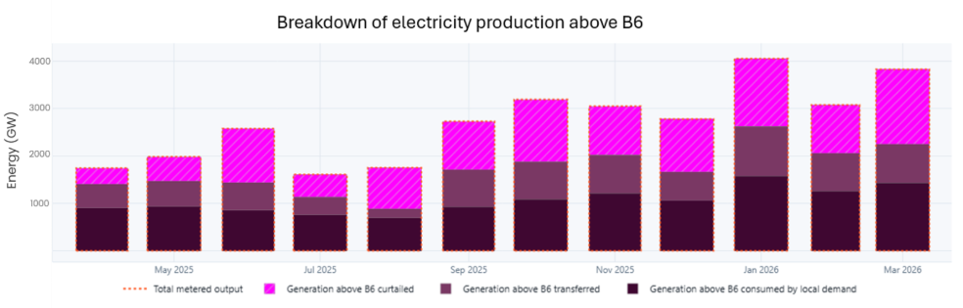
Two big things affect constraint volume
Constraint costs then reflect what we pay to redispatch power within the network limits
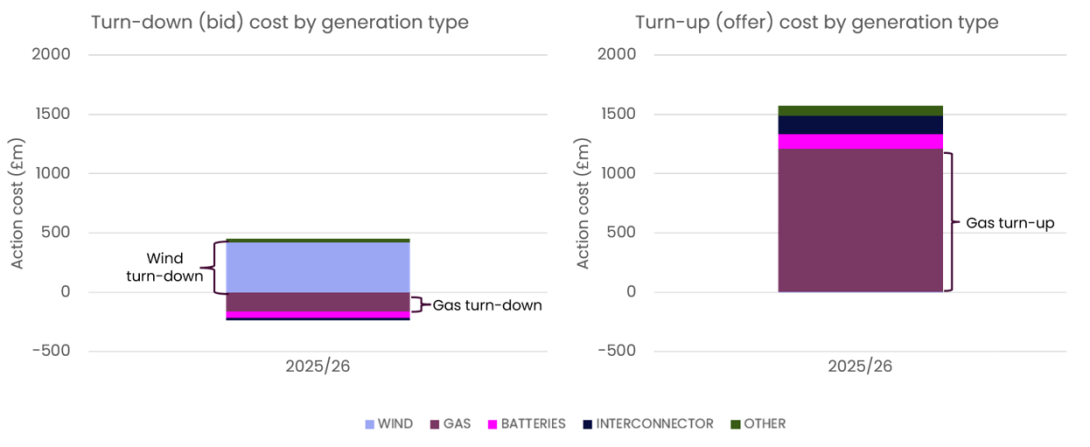
If we didn’t have the wind, we’d have lower constraints, but we’d still have to burn that gas. So most of the costs would still be incurred. Strengthening the network will help get more wind power to where it’s needed, so we can use less gas and cut costs.
Constraint costs have risen as northern wind generation connected to the grid faster than new network capacity was added to transport its electricity to the south. Ultimately the network needs to catch up, as highlighted in our advice to the UK government on its clean power target. For future plans, SSEP is optimising across generation and network to support greater coordination.
While weather and network delivery are outside NESO’s direct control, our analysis helps identify where action across the industry can have the greatest impact. Our balancing costs reports will dig into the various weather, market and network interactions that result in constraints, and set out the work needed to manage them.
So why did costs rise in 2025/26? That’s what I’ll look at next, along with what NESO and others across the industry are doing to help keep costs down.